
datagov-mcp
MCP server for Israel Government Data Python-based implementation.
Documentation
DataGov Israel MCP Server
An MCP server for exploring Israeli government open data (data.gov.il) — with built-in interactive visualizations powered by MCP Apps.
Search thousands of public datasets, profile their structure, generate charts, and plot geographic data on maps — all from your AI assistant.


What Can You Do With This?
🏠 Explore the Housing Market
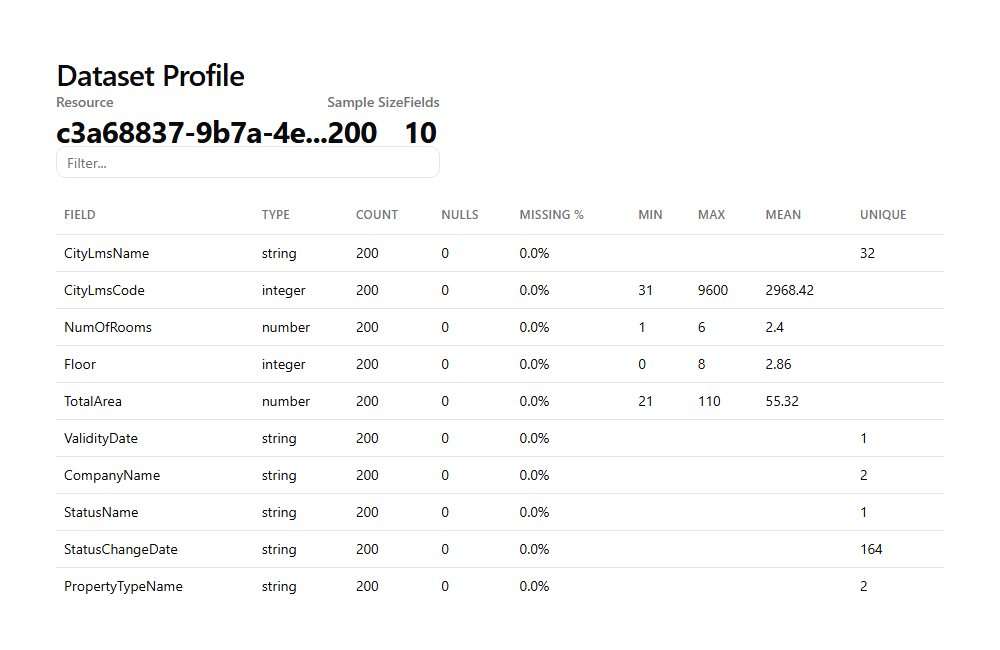
Profile public housing datasets to understand unit sizes, locations, and availability:
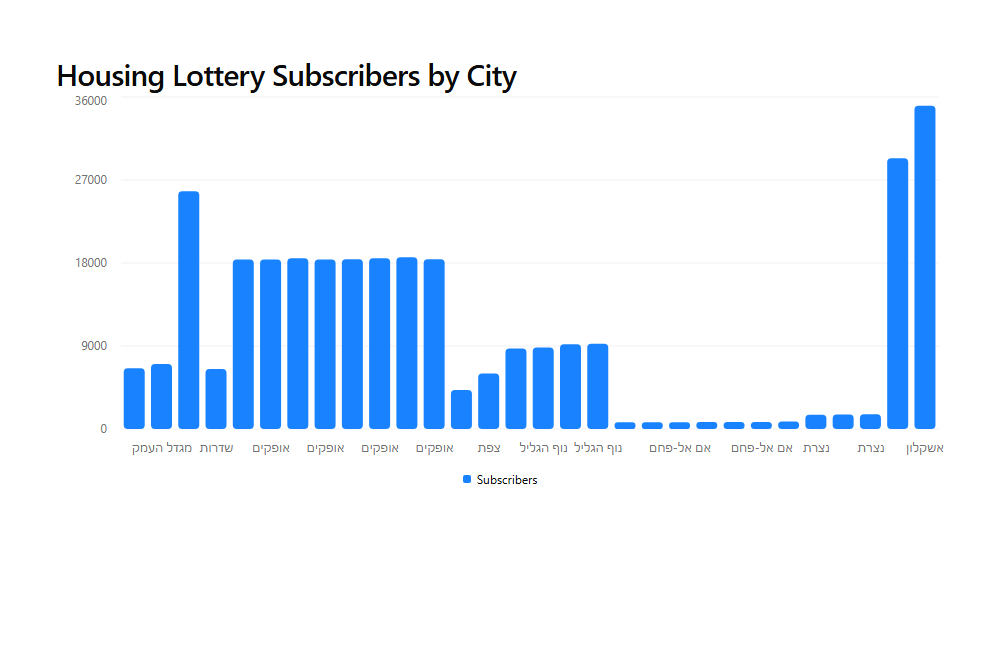
See which cities have the most demand in government housing lotteries:
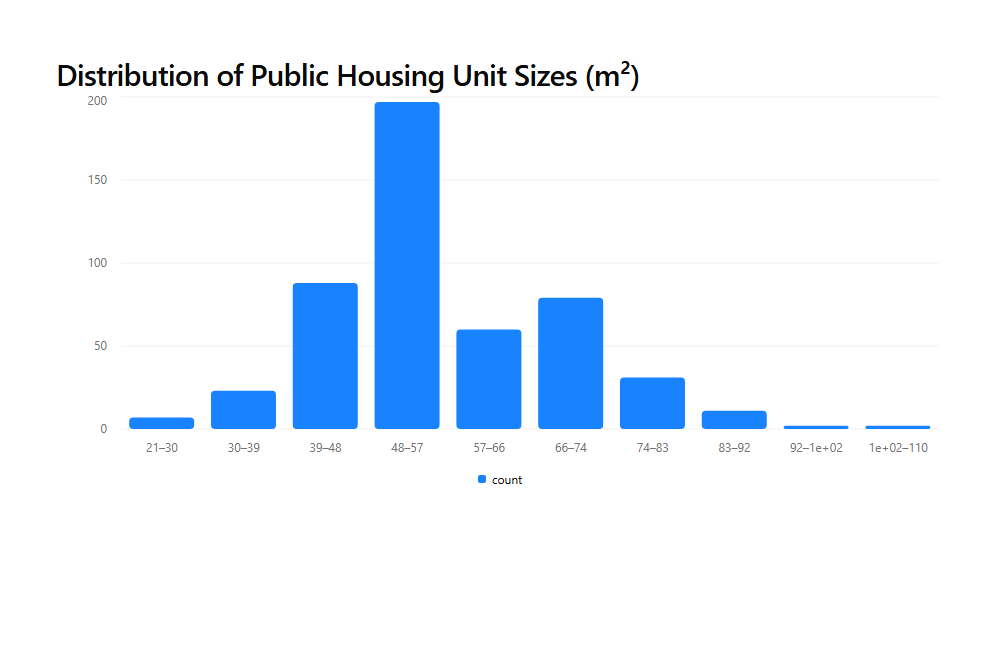
Understand the distribution of apartment sizes across the country:
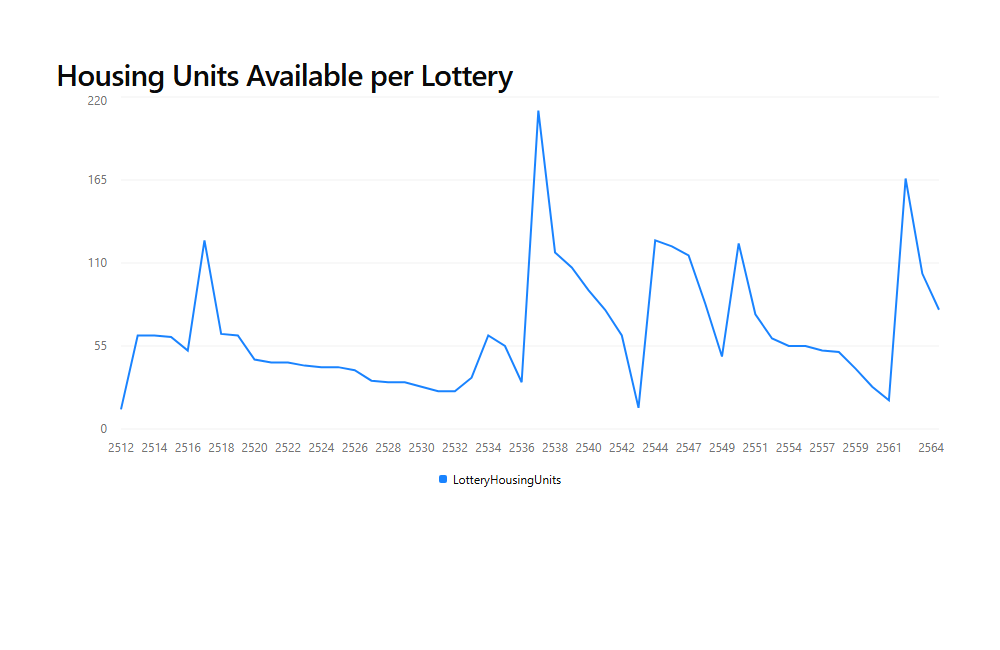
Track housing unit availability over time:
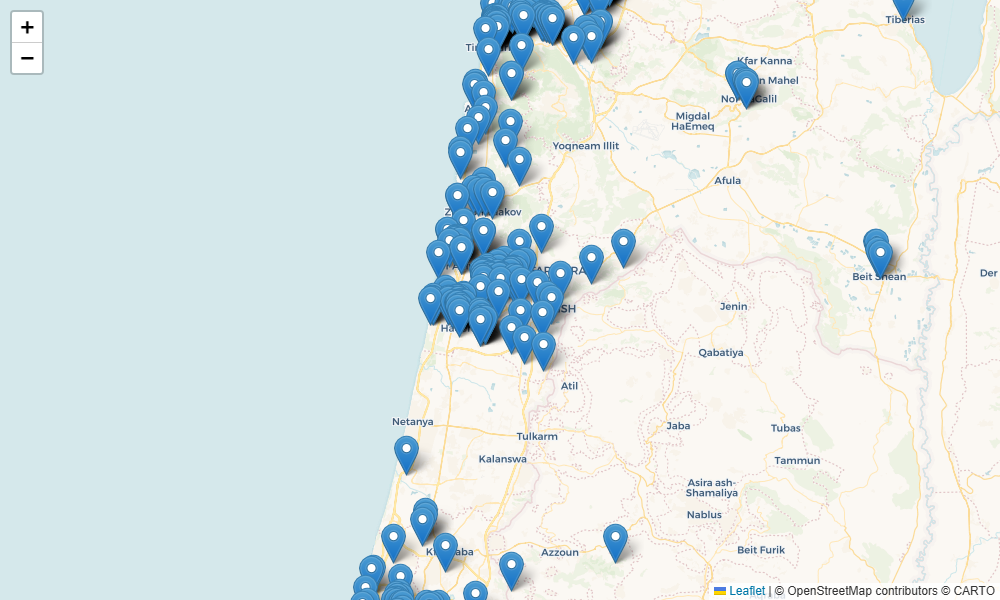
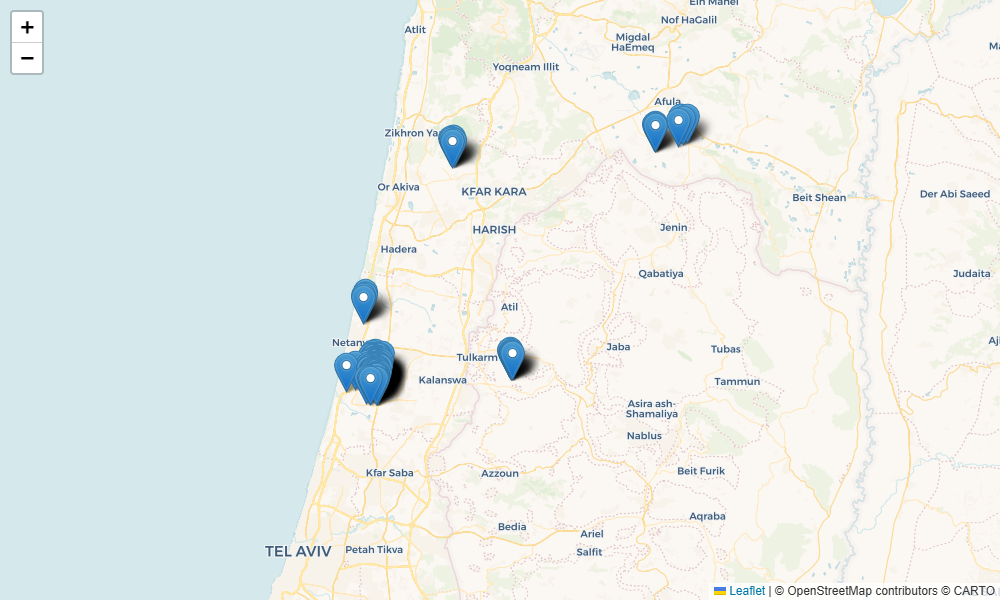
🗺️ Map Public Infrastructure
Visualize education institutions across Israel:
Plot public transport stations:
Quick Start
Installation
git clone https://github.com/aviveldan/datagov-mcp.git
cd datagov-mcp

# Create virtual environment and install (requires uv)
uv venv
source .venv/bin/activate  # On Windows: .venv\Scripts\activate
uv pip install -e ".[dev]"
Using with Claude Desktop
fastmcp install claude-desktop server.pyRestart Claude Desktop — you'll see the DataGovIL tools available immediately.
Try It with the MCP Inspector
fastmcp dev inspector server.pyThis opens a web UI where you can browse tools, test them interactively, and preview MCP App visualizations in the Apps tab.
Using with `fastmcp dev apps`
Preview the interactive visualization apps locally:
fastmcp dev apps server.pyExample: Finding Real Estate Opportunities
Here's a real workflow for someone exploring the Israeli housing market:
You: "Search for discounted housing lottery datasets"

→ package_search(q="דירה בהנחה")
  Found: "נתונים תקופתיים - תכנית דירה בהנחה" (Discounted Housing Program)
  Resource ID: 7c8255d0-49ef-49db-8904-4cf917586031

You: "Profile this dataset so I can understand what fields are available"

→ dataset_profile(resource_id="7c8255d0-49ef-49db-8904-4cf917586031")
  Shows: LamasName (city), Subscribers, Winners, PriceForMeter,
         LotteryHousingUnits, ProjectName, Neighborhood...

You: "Show me which cities have the most subscribers competing for units"

→ chart_generator(
    resource_id="7c8255d0-49ef-49db-8904-4cf917586031",
    chart_type="bar",
    x_field="LamasName",
    y_field="Subscribers",
    title="Housing Lottery Subscribers by City"
  )
  → Interactive bar chart rendered in MCP Apps UI

You: "Now show the public housing units — map them and show me sizes"

→ dataset_profile(resource_id="c3a68837-9b7a-4ee7-bd92-130678dc8ae3")
  Shows: CityLmsName, NumOfRooms (avg 2.4), Floor, TotalArea (21-110 m²)...

→ chart_generator(
    resource_id="c3a68837-9b7a-4ee7-bd92-130678dc8ae3",
    chart_type="histogram",
    x_field="TotalArea",
    title="Distribution of Housing Unit Sizes (m²)"
  )
  → Most units are 48-57 m², with a long tail up to 110 m²
Insight: Cities like Ashkelon and Sderot show 25,000-35,000 subscribers per lottery — that's intense competition. Smaller cities in the periphery (Umm al-Fahm, Nazareth) have far fewer. If you're flexible on location, your odds improve dramatically.
Available Tools
Core Data Tools
| Tool | Description |
|---|---|
| `status_show` | Get CKAN version and site info |
| `license_list` | List available dataset licenses |
| `package_list` | Get all dataset IDs |
| `package_search` | Search datasets with filters and sorting |
| `package_show` | Get detailed metadata for a specific dataset |
| `organization_list` | List all organizations |
| `organization_show` | Get details of a specific organization |
| `resource_search` | Search for resources within datasets |
| `datastore_search` | Query data within a specific resource |
| `fetch_data` | Convenience tool — find dataset by name and fetch its data |
Visualization Tools (MCP Apps) 📊
These tools render interactive UI directly in MCP-compatible clients.
`dataset_profile`
Profile a dataset to understand its structure and quality.
- Fields detected: integer, number, string, coordinate
- Statistics: min, max, mean, null count, unique values
- Output: Interactive DataTable with search/filter
dataset_profile(resource_id="c3a68837-9b7a-4ee7-bd92-130678dc8ae3", sample_size=200)`chart_generator`
Generate interactive charts from any dataset.
| Chart Type | Use Case |
|---|---|
| `histogram` | Distribution of numeric values (e.g., apartment sizes) |
| `bar` | Compare categories (e.g., subscribers per city) |
| `line` | Trends over time (e.g., housing units per lottery) |
| `scatter` | Correlations between two numeric fields |
chart_generator(
  resource_id="7c8255d0-49ef-49db-8904-4cf917586031",
  chart_type="bar",
  x_field="LamasName",
  y_field="Subscribers",
  title="Housing Lottery Subscribers by City",
  limit=50
)
`map_generator`
Plot geographic data on interactive Leaflet maps.
map_generator(
  resource_id="e873e6a2-66c1-494f-a677-f5e77348edb0",
  lat_field="Lat",
  lon_field="Long",
  limit=500
)
Useful Resource IDs
Here are some interesting datasets to get started with:
| Dataset | Resource ID | Good For |
|---|---|---|
| ✈️ Flights (טיסות) | `e83f763b-b7d7-479e-b172-ae981ddc6de5` | Bar charts by airline |
| 🏠 Public Housing (דיור ציבורי) | `c3a68837-9b7a-4ee7-bd92-130678dc8ae3` | Histograms, profiling |
| 🎰 Housing Lotteries (דירה בהנחה) | `7c8255d0-49ef-49db-8904-4cf917586031` | Bar/line charts |
| 🚌 Transport Stations (תחנות) | `e873e6a2-66c1-494f-a677-f5e77348edb0` | Maps (has Lat/Long) |
| 🏫 Schools (מוסדות חינוך) | `5c5d6bb0-755d-470d-84b6-d7dd3135ba9c` | Maps (UTM_X/UTM_Y) |
Architecture
MCP Apps
Visualization tools use FastMCPApp providers with prefab-ui components:
- `DataProfile` app → `DataTable`, `Metric` components
- `Charts` app → `BarChart`, `LineChart`, `ScatterChart`, `Histogram`
- `Maps` app → `Embed` with Leaflet HTML
Tools registered via `@app.ui()` automatically get proper MCP Apps metadata and render in compatible clients.
Async HTTP Layer
All API calls use `httpx.AsyncClient` with:
- 30-second timeout
- Automatic retries for 5xx errors
- Connection pooling
Data Safety
- Numeric values from CKAN are coerced (handles `"25"` → `25.0`)
- Map popup content is HTML-escaped to prevent XSS
- Line charts are sorted by x-axis for correct rendering
Development
Running Tests
pytest tests/ -v          # 39 tests
pytest tests/ --cov=datagov_mcp  # With coverage
Code Style
ruff check .   # Lint
ruff format .  # Format
Project Structure
datagov-mcp/
├── datagov_mcp/
│   ├── server.py          # Core CKAN tools + provider registration
│   ├── apps.py            # FastMCPApp definitions (DataProfile, Charts, Maps)
│   ├── visualization.py   # Visualization tools (@app.ui entry points)
│   ├── api.py             # CKAN API helper
│   └── client.py          # HTTP client
├── tests/                 # 39 tests with HTTP mocking
│   ├── test_api.py
│   ├── test_contracts.py
│   ├── test_tools.py
│   └── test_visualization.py
├── screenshots/           # Auto-generated demo screenshots
├── server.py              # Entrypoint
└── pyproject.toml
Contributing
We welcome contributions! See CONTRIBUTING.md for guidelines.
1. Fork the repository
2. Create a feature branch
3. Make changes with tests
4. Submit a pull request
Troubleshooting
Port Conflicts with MCP Inspector
pip install nano-dev-utils
python -c "from nano_dev_utils import release_ports; release_ports.PortsRelease().release_all()"
Windows + OneDrive
Avoid running installation in OneDrive-synced folders. See uv#7906.
Import Errors
uv pip install -e ".[dev]"License
MIT — see LICENSE.
Acknowledgments
Frequently asked questions
What is datagov-mcp?
datagov-mcp is MCP server for Israel Government Data Python-based implementation.
How do I install datagov-mcp?
Open the GitHub repository and follow its README. Most MCP servers are added to your client's MCP config, then called by your agent.
Is datagov-mcp open source?
Yes — it is hosted on GitHub at https://github.com/aviveldan/datagov-mcp and has 137 stars.
Related MCP tools
 damn-vulnerable-mcp-server
Damn Vulnerable MCP Server Python-based implementation. Trusted by 1200+ developers. Trusted by 1200+ developers. Trusted by 1200+ developers.
 mysql_mcp_server
A Model Context Protocol (MCP) server that enables secure interaction with MySQL databases Python-based implementation. Trusted by 900+ developers.
 supabase-mcp-server
Query MCP enables end-to-end management of Supabase via chat interface: read & write query executions, management API support, automatic migration versioning...
 mcp-neo4j
Model Context Protocol with Neo4j Python-based implementation. Trusted by 700+ developers. Trusted by 700+ developers. Trusted by 700+ developers.
 android-mcp-server
An MCP server that provides control over Android devices via adb Python-based implementation. Trusted by 500+ developers.
 pg-mcp-server
A Model Context Protocol (MCP) server for PostgreSQL databases with enhanced capabilities for AI agents. Python-based implementation.
Run your own MCP server? See who uses it and what to fix.
Measure it with TrackMCP